


U.S. Census Bureau Photo
Construction, utilities fared better than other sectors in Phase 1
By Jane A Callen/U.S. Census Bureau
WASHINGTON D.C. – In mid-May 2020, the U.S. Census Bureau pioneered a new weekly survey to take the pulse of how America’s small businesses were faring in the midst of the coronavirus pandemic.
In the ensuing nine-week period that the Small Business Pulse Survey (SBPS) was in the field, we heard from over 215,000 businesses across the country. These companies of one to 499 employees provided important new insights into the effects of the pandemic.
The survey was so successful that on August 9, the Census Bureau launched Phase 2 with the first round of responses expected today and every Thursday at 10 a.m. To access the data, go here: portal.census.gov/pulse/data/
The SBPS measures the core concepts central to small business operations, such as employment, revenue, and supply chain disruption. It also measures financial issues such as assistance, liquidity, and payment defaults. Finally, it is designed to gauge the overall impact and expectations. Phase 2 of the SBPS expands to cover new topics, including:
- Rehiring furloughed or laid-off employees.
- Effects on the business supply chain. (This would replace the current question about supply chain disruption.)
- Changes in the number of hours employees work from home.
- Changes in the use of online platforms to offer goods and services.
- Factors that affect capacity and changes in capacity.
- Need for a future assistance program.
What did we learn in Phase 1?
Nationally, respondents initially indicated pervasive difficulties with business operations and finances, including temporary closings, employment, revenues, and cash on hand. However, these difficulties became less prevalent over the nine weeks of the survey.

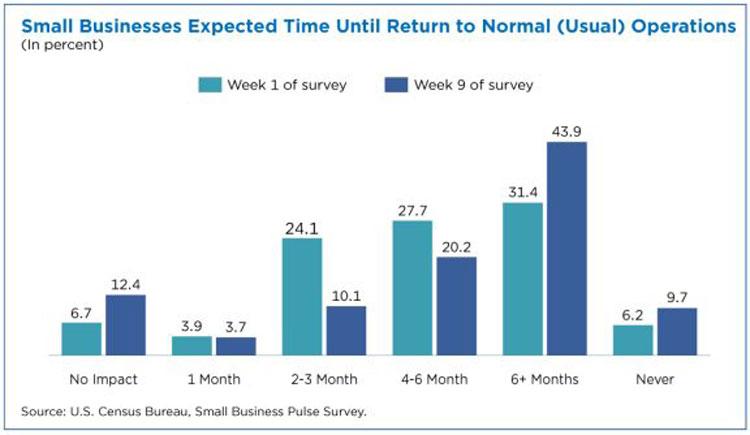
Another significant finding: how long respondents think it will take their businesses to bounce back completely. Initially, more than 30% of respondents said they didn’t think their businesses would return to normal or usual for at least six months, and nearly 25% said it might be possible in two to three months. The optimism remained fairly static over the next few weeks.
Outlook varied by industry
Views on returning to normal varied by industry. The construction industry tended to be more optimistic.
For example, by week six, the number of construction-sector respondents saying they would not return to normal for four to six months or more declined, and the percentage saying it would happen within two to three months increased: 19.3% in construction versus 13.3% for the national average.
Outlook varied by geography
Responses by geography were added in the second week. This data showed how utilization of the Paycheck Protection Program (PPP) varied across states and over time.
For instance, between weeks one and three, the percentage of businesses that reported receiving assistance, including PPP, rose from 38.1% to 66.8% and some coastal states (California and Massachusetts) showed they were catching up to interior states (South Dakota and Oklahoma) in their use of PPP.

The Census Bureau also saw a great deal of variation across Metropolitan Statistical Areas, states and sectors.
For instance, in Salt Lake City, 20% of businesses reported little or no impact and 17% reported no change in operations year-over-year. However, in New York City, 7% of businesses reported little or no impact 7% reported no change in operations year-over-year.
Which sectors fared worse or better during the pandemic?
The categories “education and services,” “health care and social assistance,” “arts, entertainment, and recreation,” and “accommodation and food services” saw significant disruptions based on initial responses and this persisted over the nine weeks of the survey.
Utilities and construction fared reasonably well over the nine weeks of the survey and respondents reported already being almost back to normal and had the largest percentage reporting no change in revenue.
Other weekly surveys providing near-real-time data
In addition to the SBPS, the Census Bureau also launched the weekly Household Pulse Survey in May.
Both Pulse surveys are produced and released as part of the Census Bureau’s Experimental Data Product Series.
The Census Bureau has also introduced other weekly products, including a more localized version of its Business Formation Statistics (BFS) rolled out in the spring
Initially released as a quarterly, experimental product in February 2018, BFS tracks trends in business applications and formations at the state, regional and national levels. The new weekly data provide timely and granular information on the state of the economy.
Additional Census Bureau information relating to the pandemic is available here.
Jane A Callen is senior editor/writer of the Census Bureau’s Communications Directorate.