
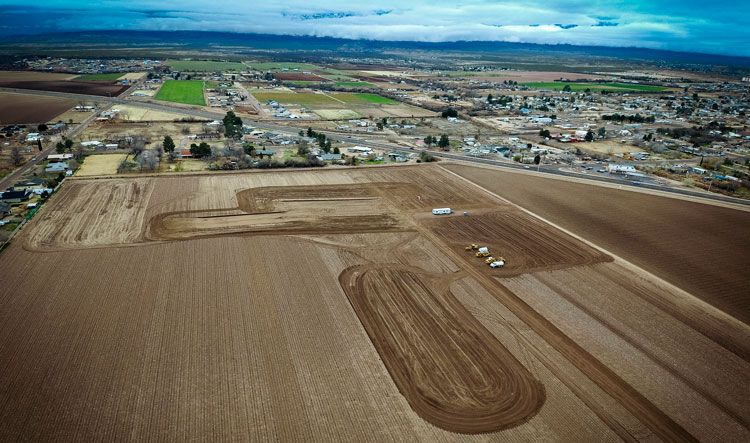
Jon Johnson File Photo/Gila Herald: An aerial view shows the beginning of construction of Pima’s new high school. In this article, Pima Superintendent Sean Rickert gives a breakdown of school spending and the Arizona Auditor General’s annual report.
By Sean E. Rickert/Pima Schools Superintendent

PHOENIX – It is March, so the Arizona Auditor General’s office has published the school spending report analyzing how well our schools have done in their effort to turn taxpayer money into a quality education for Arizona’s children. The report is long and wonky. It includes lots of numbers, but what does it say about the things people really care about?
Overall, we expect schools to meet the needs of children to develop, learn, and eventually be prepared for a prosperous future. The report says a lot about how schools are doing in this effort, and it outlines how that effort is affected by the money they have available.
First, we might reasonably assume that all things being equal, a school that spends $52,000 per pupil on a child’s needs should do a better job than one spending $8,300. Not so in Arizona. Not even close. Let’s take all schools and rank them based on per-pupil spending on operations. That’s spending on things other than buildings, property acquisition, equipment, and interest on debt. The bottom tenth includes twenty districts. It is where we will find Safford, Thatcher, and Pima. All of these twenty poorest districts are in the top half of districts based on Reading test scores and all but two are in the top half based on math. The two with poor math performance are not in Graham County. School spending is not a guarantee of performance.
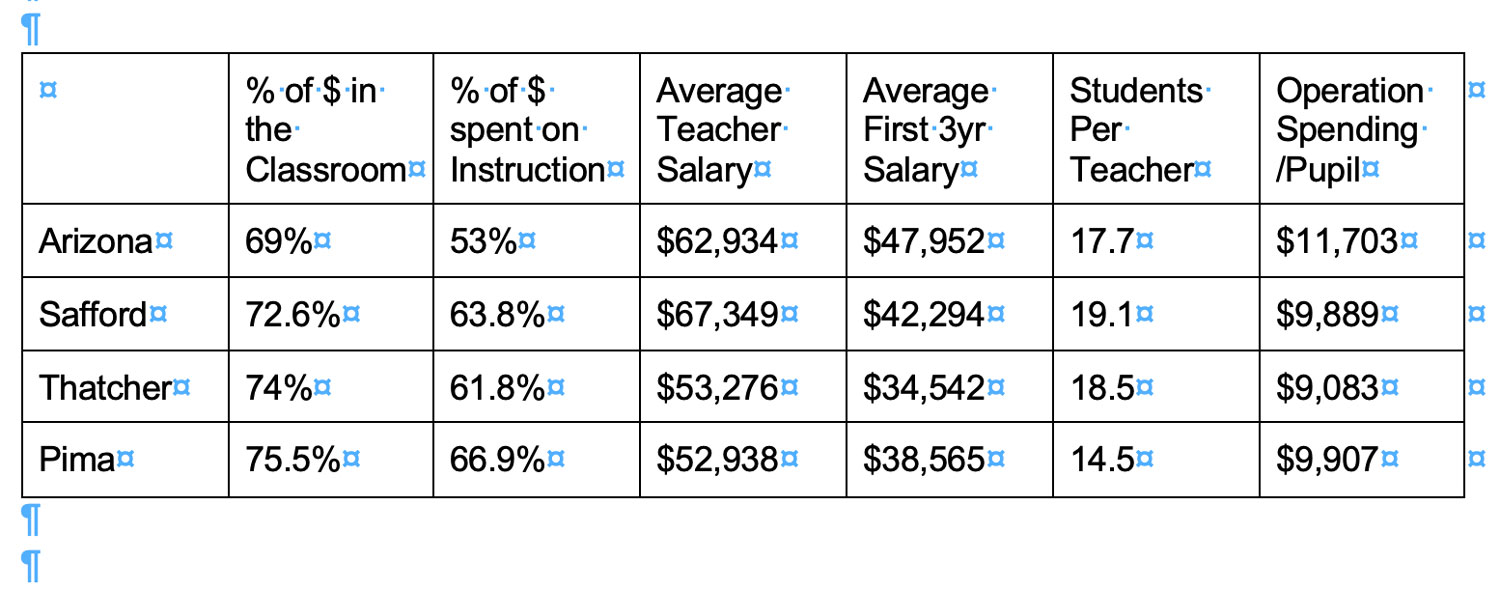
Schools in Arizona fall into four bands of per-pupil spending. There are those in the $18,000 to $52,000 band. These are either very small districts where enrollment doesn’t determine budget capacity, or districts receiving supplemental funding from the federal government. Bonita Elementary falls into the very small group, spending $22,000 per student. Fort Thomas falls in the second group and spends about $20,000 per pupil. Next, some districts supplement their budgets through additional funding from extra property taxes. These override districts generally have large property taxpayers like power plants, mines, or significant commercial and industrial facilities. They spend between $11,000 and 18,000 per pupil. Charter schools are not included in the report, but they receive between $10,000 and $11,000 per pupil. Then we have the rest. Districts like Safford, Thatcher, and Pima are spending less than $10,000 per pupil. The lowest is Thatcher which spends roughly 75% of the state average.

The report also provides information about teacher salaries. We know that teachers are the most important factor affecting the education of our students, and how well they are paid makes a difference. Teachers with more experience get paid better than teachers with little experience, so the report includes information about teacher longevity by district. Statewide, the average teacher has nearly 12 years of experience and gets paid $62,934. In Graham County, average Teacher Salaries range from $52,938 in Pima to $67,349 in Safford. But the average teacher in Safford has almost 11 years of experience while Pima’s teachers average less than 9 years. Experienced teachers get paid more, and 44% of teachers in Pima are in their first three years of service, more than twice the level found in Safford. The statewide average salary for teachers in their first three years is close to $48,000, but new teachers in the Gila Valley average between $34,500 and $42,000. The lower salaries are largely attributed to the lower overall per-pupil spending. Another factor affecting teacher salaries is class size. Funding is based on the number of students, so if you have more students for each teacher, there is more money to put towards salaries. Thatcher and Safford both have higher student-to-teacher ratios than the state average, but Pima’s is lower.
Where we see a remarkable difference between Graham County schools and the state average is the percentage of funding that is used for instructional costs, especially the percentage that finds its way into the classroom. Statewide the average school district spends $0.69 out of every dollar on instructional services and $0.53 in the classroom. When we look at Thatcher, Safford, and Pima we find that they target between 72.6% and 75.5% of their expenditures on instructional expenditures, and between 62% and 67% of their spending gets into the classroom. This demonstrates the commitment to getting the limited funding available into the classroom where it can have the greatest impact on student learning.
Research shows that nothing correlates more closely to student achievement than the commitment a district makes to putting resources close to where the student learns. Safford, Thatcher, and Pima are each in different ‘Peer Groups’ based on their size, but all are at the very top of their peer group based on their operational efficiency. In Graham County, the money is spent on instruction at a higher rate than anywhere else in the state. Arizona has the most efficient schools in the nation and possibly even the world. Per dollar spent on education, we generate more academic achievement and growth than any other school system anywhere. This is a tribute to the commitment of our educators. Nowhere is this more evident than in Graham County where our schools put half again the percentage of resources in the classroom found on average across the state. Although we spend less, we invest more carefully and we get better outcomes than you’d expect.