

Key Takeaways
| 1 | Arizona ranks No. 5 nationally with a fatal work zone crash rate of 12.31 per 100,000 construction workers, 2 times the national average and 15.2% higher than the sixth-ranked state, North Carolina. |
| 2 | Fatal work zone crashes in Arizona surged 47.4% between 2020 and 2024, rising from 19 to 28, with crashes nearly doubling in a single year from 15 in 2022 to 28 in 2023. |
| 3 | Arizona recorded more fatal work zone crashes than the 10 safest states combined (108 vs. 79), despite employing fewer than one-eleventh as many construction workers. |
Every day across Arizona, construction workers, many of them Hispanic, step into active highway lanes to build and repair the roads that keep one of the fastest-growing states in the Sun Belt moving. Their job sites are not walled-off buildings or fenced lots but open stretches of pavement where the only barrier between them and speeding traffic is a row of orange cones and plastic barrels. For the crews pouring concrete and guiding heavy equipment along these corridors, every shift carries the possibility that a passing driver’s momentary distraction could turn deadly.
A study conducted by Los Defensores analyzed five years (2020 to 2024) of fatal construction zone crash data from the NHTSA Fatality Analysis Reporting System, combined with average annual construction worker employment estimates from the U.S. Census Bureau. For each state, the average annual number of fatal crashes was divided by the average annual construction workforce and multiplied by 100,000 to produce a comparable per-worker risk rate.
Arizona at a Glance: A State Profile of Work Zone Fatality Risk
| Arizona: State Profile | |
| Average Annual Construction Workers (2020 to 2024) | 175,488 |
| Total Fatal Work Zone Crashes (2020 to 2024) | 108 |
| Average Annual Fatal Crashes | 21.6 |
| Rate per 100,000 Construction Workers | 12.31 |
| National Rank (Highest Risk) | 5 of 50 |
| Share of All U.S. Fatal Work Zone Crashes | 4.2% |
| Change in Fatal Crashes, 2020 to 2024 | +47.4% |
| National Average Rate per 100,000 Workers | 5.50 |
Where Arizona Ranks Among the Nation’s Highest-Risk States
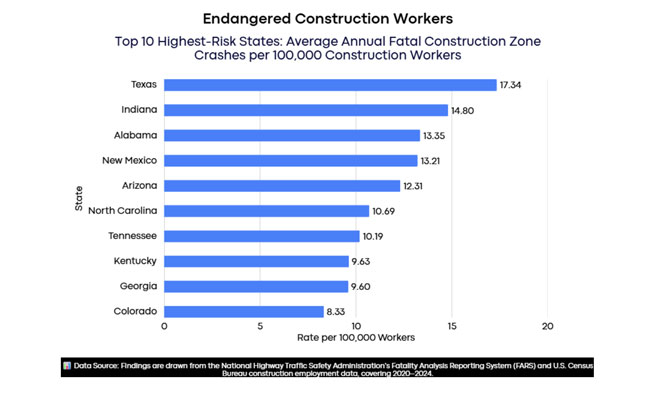
Top 10 Highest-Risk States: Average Annual Fatal Construction Zone Crashes per 100,000 Construction Workers
| Rank | State | Avg. Annual Construction Workers | Avg. Annual Fatal Crashes | Rate per 100,000 Workers |
| 1 | Texas | 885,849 | 153.6 | 17.34 |
| 2 | Indiana | 156,800 | 23.2 | 14.80 |
| 3 | Alabama | 115,374 | 15.4 | 13.35 |
| 4 | New Mexico | 59,064 | 7.8 | 13.21 |
| 5 | Arizona | 175,488 | 21.6 | 12.31 |
| 6 | North Carolina | 252,634 | 27.0 | 10.69 |
| 7 | Tennessee | 168,815 | 17.2 | 10.19 |
| 8 | Kentucky | 95,543 | 9.2 | 9.63 |
| 9 | Georgia | 243,669 | 23.4 | 9.60 |
| 10 | Colorado | 160,797 | 13.4 | 8.33 |
Arizona holds the fifth-highest rate in the nation at 12.31 per 100,000 workers, sitting 15.2% above the sixth-ranked state, North Carolina (10.69).
Arizona Compared to the 10 Safest States for Work Zone Crashes
Arizona vs. 10 Lowest-Risk States: Fatal Construction Zone Crash Rates and Gap (2020 to 2024)
| Rank | State | Avg. Annual Construction Workers | Avg. Annual Fatal Crashes | Rate per 100,000 Workers | Gap (Points Below Arizona) |
| 5 | Arizona | 175,488 | 21.6 | 12.31 | Ref. |
| 50 | Virginia | 183,062 | 0.4 | 0.22 | 12.09 |
| 49 | Ohio | 235,083 | 0.8 | 0.34 | 11.97 |
| 48 | Maryland | 145,639 | 0.6 | 0.41 | 11.90 |
| 47 | Maine | 39,179 | 0.2 | 0.51 | 11.80 |
| 46 | Florida | 561,884 | 5.4 | 0.96 | 11.35 |
| 45 | South Carolina | 117,212 | 1.2 | 1.02 | 11.28 |
| 44 | New Hampshire | 38,078 | 0.4 | 1.05 | 11.26 |
| 43 | New York | 394,277 | 4.4 | 1.12 | 11.19 |
| 42 | Wisconsin | 136,571 | 1.6 | 1.17 | 11.14 |
| 41 | Nebraska | 49,963 | 0.8 | 1.60 | 10.71 |
The 10 safest states employ over 1.9 million construction workers combined, more than eleven times the Arizona workforce, yet together recorded only 79 fatal crashes in five years, fewer than Arizona’s 108. Virginia, ranked 50th, operates at a rate of 0.22, nearly 56 times lower than that of Arizona at 12.31.
Methodology
This study analyzed fatal construction zone crashes across all 50 U.S. states from 2020 through 2024 using data from the National Highway Traffic Safety Administration’s Fatality Analysis Reporting System (FARS). State-level average annual construction worker employment counts for the 2020 to 2024 period were sourced from the U.S. Census Bureau. For each state, the average annual number of fatal construction zone crashes was divided by the average annual construction workforce and multiplied by 100,000 to produce a comparable per-worker risk rate, and states were ranked from highest to lowest.
Data Sources
NHTSA Fatality Analysis Reporting System (FARS): https://cdan.dot.gov/query
U.S. Census Bureau, Construction & Extraction Employment: https://data.census.gov
Research Dataset: https://docs.google.com/spreadsheets/d/1AJJd4tkPF7TO0yTTPO_D7eCMvNzXxUHxoQgLkhKaLQw/edit?gid=0#gid=0
Study by: https://www.losdefensores.com/en/
About Los Defensores
Founded in 1984, Los Defensores connects members of the Latino community with independent attorneys in its network. For over four decades, the organization has worked to improve access to legal assistance in areas including workplace injuries, motor vehicle accidents, and labor law.