

Key Takeaways
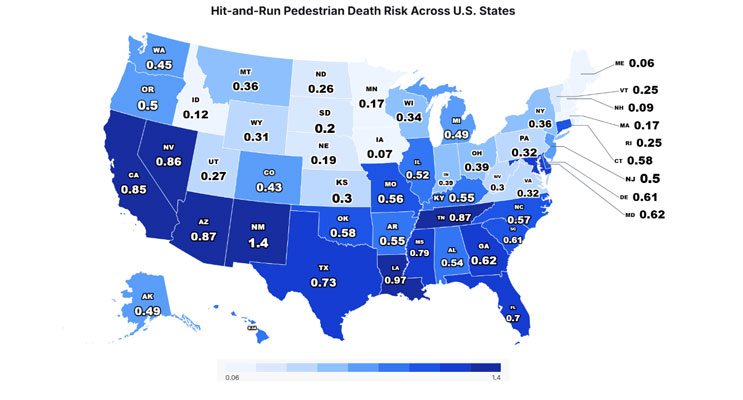
- Arizona recorded the fourth-highest hit-and-run pedestrian fatality rate in the entire United States at 0.87 per 100,000 residents from 2020 to 2024, averaging 64.2 deaths per year.
- Hit-and-run pedestrian fatalities in Arizona surged 29.0% between 2021 and 2022 (from 62 to 80 deaths), and remained elevated through 2024, with 56 deaths recorded in the most recent year of data.
- Arizona’s rate of 0.87 per 100,000 ties with Tennessee (0.87), is 1% higher than Nevada (0.86), and trails New Mexico (1.40), underscoring the severity of the crisis within the state and the region.
Arizona faces a pedestrian safety crisis that demands urgent attention. According to a new analysis of federal crash data, the state recorded the fourth-highest hit-and-run pedestrian fatality rate in the nation from 2020 to 2024, with an average of 64.2 pedestrians killed annually by drivers who fled the scene. For a state with approximately 7.4 million residents, the toll is staggering, and the rate is nearly 15 times higher than Maine, the safest state in the country for this measure.
The study conducted by Grigor Law Injury & Car Accident Lawyers analyzed five years (2020–2024) of hit-and-run pedestrian fatality data from the NHTSA Fatality Analysis Reporting System (FARS) via the CDAN query tool across all 50 U.S. states. For each state, the average annual number of pedestrian fatalities involving a hit-and-run driver was calculated, then divided by the state’s population and multiplied by 100,000 to produce a per capita rate. States were ranked from highest to lowest per capita rate.
How Arizona Compares: Top 10 States With the Highest Hit-and-Run Pedestrian Fatality Rates

States With the Most Hit-and-Run Pedestrian Deaths Per 100,000 Residents (2020–2024)
| Rank | State | Population | 2020 | 2021 | 2022 | 2023 | 2024 | Avg. | Rate /100K |
|---|---|---|---|---|---|---|---|---|---|
| 1 | New Mexico | 2,118,467 | 23 | 36 | 28 | 30 | 31 | 29.6 | 1.40 |
| 2 | Louisiana | 4,607,560 | 31 | 52 | 56 | 41 | 44 | 44.8 | 0.97 |
| 3 | Tennessee | 7,061,377 | 73 | 50 | 72 | 59 | 54 | 61.6 | 0.87 |
| 4 | Arizona | 7,367,185 | 53 | 62 | 80 | 70 | 56 | 64.2 | 0.87 |
| 5 | Nevada | 3,179,849 | 21 | 24 | 28 | 37 | 26 | 27.2 | 0.86 |
| 6 | California | 39,233,367 | 282 | 355 | 355 | 357 | 315 | 332.8 | 0.85 |
| 7 | Mississippi | 2,946,233 | 23 | 16 | 22 | 29 | 26 | 23.2 | 0.79 |
| 8 | Texas | 30,117,201 | 201 | 224 | 229 | 218 | 225 | 219.4 | 0.73 |
| 9 | Florida | 22,320,038 | 147 | 181 | 159 | 165 | 128 | 156.0 | 0.70 |
| 10 | Maryland | 6,189,390 | 40 | 36 | 44 | 33 | 39 | 38.4 | 0.62 |
New Mexico recorded the nation’s highest hit-and-run pedestrian fatality rate at 1.40 per 100,000 residents. Arizona, ranked 4th, recorded a rate of 0.87 per 100,000, averaging 64.2 deaths per year over the five-year period. The rankings are dominated by Sun Belt and Southern states, highlighting persistent pedestrian safety challenges.
Looking at the study, Chrissy Grigoropoulos, Founder of Grigor Law Injury & Car Accident Lawyers, commented:
“The data paints a deeply alarming picture for Arizona. At 0.87 per 100,000 residents, the state’s hit-and-run pedestrian fatality rate is the fourth-highest in the country. These are preventable tragedies that leave families without answers or accountability. Arizona urgently needs improved street design, stronger hit-and-run penalties, expanded crash investigation resources, and greater investment in pedestrian infrastructure to reverse this devastating trend and protect its communities.”
Arizona Hit-and-Run Pedestrian Fatalities: Year-by-Year Breakdown (2020–2024)
Annual Hit-and-Run Pedestrian Deaths in Arizona

| Year | Pedestrian Fatalities by Hit-and-Run |
|---|---|
| 2020 | 53 |
| 2021 | 62 |
| 2022 | 80 |
| 2023 | 70 |
| 2024 | 56 |
| 5-Year Average | 64.2 |
Hit-and-run pedestrian fatalities in Arizona jumped sharply in 2022, rising from 62 deaths to 80, a 29.0% increase in a single year. While fluctuations occurred year to year, deaths rose from 53 in 2020 to 56 in 2024, a 5.7% increase, indicating a worsening trend. Over the full five-year period, Arizona averaged 64.2 hit-and-run pedestrian deaths per year, translating to a rate of 0.87 per 100,000 residents, the fourth-highest in the nation.
Methodology
This study analyzed five years (2020–2024) of pedestrian fatality data involving hit-and-run drivers using the NHTSA Fatality Analysis Reporting System (FARS), accessed via the CDAN query tool (cdan.dot.gov/query). For each of the 50 U.S. states, the total number of pedestrian fatalities in hit-and-run crashes was collected for each year from 2020 through 2024. The five-year average was then calculated for each state. This average was divided by each state’s estimated population (2020–2024 average) and multiplied by 100,000 to calculate the rate per 100,000 residents. States were ranked from highest to lowest per capita rate.
Data Sources
Data Source: NHTSA Fatality Analysis Reporting System (FARS) via CDAN
Hit-and-Run Pedestrian Fatality Data:
Research Dataset: https://docs.google.com/spreadsheets/d/1YY44jObsY6SBr74PFzC_puZW1wDNDoXTOo6Nabc3bp8/edit?gid=0#gid=0
Study By: https://grigorlaw.com
About Grigor Law Injury & Car Accident Lawyers
Grigor Law Injury & Car Accident Lawyers represents injured individuals and their families in serious personal injury and car accident cases across the United States. The firm produces data-driven research to inform policymakers, journalists, and communities on highway safety.