
- Douglas has the highest intersection accident rate of 127.9 accidents per 100,000 residents.
- Corona De Tucson (110.6) and Show Low (109.4) follow in second and third place.
- San Tan Valley reported 9.5 intersection accidents per 100,000 residents, the lowest among all the cities in Arizona.
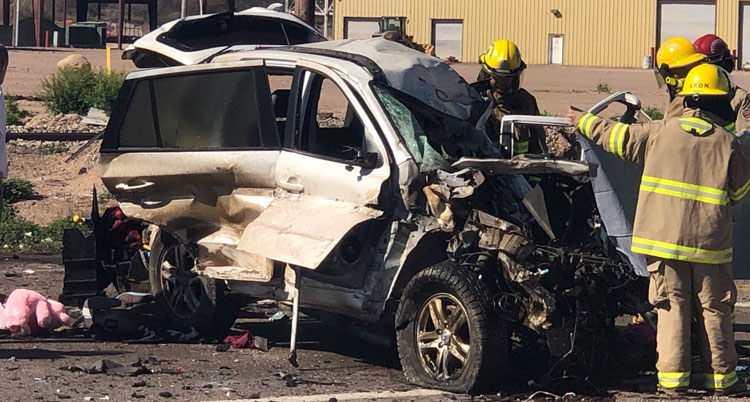
A new study has revealed that Douglas reported the highest intersection accidents in Arizona.
A new study by Nevada-based personal injury lawyers H&P Law analyzed intersection accident data for the 50 most populous Arizona cities from the National Highway Traffic Safety Administration (NHTSA) between 2018 and 2022. The average number of accidents per 100,000 residents each year was calculated to rank cities with the highest intersection accident rates.
Douglas leads the state with 127.9 intersection accidents per 100,000 residents, 145% above the statewide average of 52.2 accidents per 100,000 residents. With a population of 15,638, the border city recorded an average of two intersection accidents between 2018 and 2022.
Corona De Tucson is second with 110.6 intersection accidents per 100,000 residents — roughly 112% higher than the statewide average. The city, which has a population of 9,039, reported an average of one intersection accident each year between 2018 and 2022.
Show Low takes the third spot with 109.4 intersection accidents per 100,000 residents, exceeding the statewide average by 109%. The mountain city of 12,192 residents recorded an average of 1.33 intersection accidents each year between 2018 and 2022.

Looking at the study, a spokesperson for H&P Law commented:
“The study reveals intersections across Arizona’s cities record the highest numbers of incidents per 100,000 residents, with Douglas, Corona De Tucson, and Show Low showing particularly concerning rates.
“At intersections, drivers often speed, get distracted, or fail to judge turning gaps correctly. Pedestrians and cyclists are especially at risk, as they share the same space while vehicles navigate multiple directions of travel.
“Motorists are urged to maintain legal speeds, stay focused on the road, and exercise caution when approaching yellow lights. Meanwhile, policy initiatives like installing clearer signage, optimizing signal timing, and improving lighting can help reduce the frequency and severity of intersection-related crashes.”
Coolidge ranks fourth with 109.3 intersection accidents per 100,000 residents — roughly 109% above the statewide average. With a population of 18,293, the central Arizona city reported an average of two intersection accidents each year between 2018 and 2022.
Camp Verde slides into fifth place with 106.8 intersection accidents per 100,000 residents — about 105% more than the average. With a population of 12,489, the city recorded an average of 1.33 intersection accidents each year between 2018 and 2022.
Sedona follows in sixth with 101.8 accidents per 100,000 residents, followed by Safford claims seventh with 97.4 per 100,000. Tucson is eighth with 86.6 per 100,000, Fountain Hills ranks ninth with 84.7 per 100,000, while Gold Canyon rounds out the top 10 with 80.1 per 100,000.
Table of Extended Results:
| Top 10 Arizona Cities With the Highest Intersection Accidents | ||||
| Arizona City | Average Intersection Accidents (2018-2022) | Population | Average Intersection Accidents oer 100,000 Population | Rank |
| Douglas | 2.00 | 15,638 | 127.9 | 1 |
| Corona De Tucson | 1.00 | 9,039 | 110.6 | 2 |
| Show low | 1.33 | 12,192 | 109.4 | 3 |
| Coolidge | 2.00 | 18,293 | 109.3 | 4 |
| Camp Verde | 1.33 | 12,489 | 106.8 | 5 |
| Sedona | 1.00 | 9,819 | 101.8 | 6 |
| Safford | 1.00 | 10,270 | 97.4 | 7 |
| Tucson | 47.40 | 547,239 | 86.6 | 8 |
| Fountain Hills | 2.00 | 23,611 | 84.7 | 9 |
| Gold Canyon | 1.00 | 12,488 | 80.1 | 10 |
The study was conducted by H&P Law, an experienced personal injury law firm dedicated to protecting clients’ rights and maximizing claim value.
Methodology
The research analyzed intersection accident data for the 50 most populous Arizona cities from the National Highway Traffic Safety Administration (NHTSA) between 2018 and 2022. The average number of accidents per 100,000 residents each year was calculated to rank cities with the highest intersection accident rates.
Data Source
- Intersection Accidents Data: https://cdan.dot.gov/query
- Research Database: https://docs.google.com/spreadsheets/d/1q-xfEXo77kV0uDVj4a3RUEfmNpfW_hxHUs_SkqfGq6U/edit?gid=595465842#gid=595465842
- Study by: http://www.courtroomproven.com/