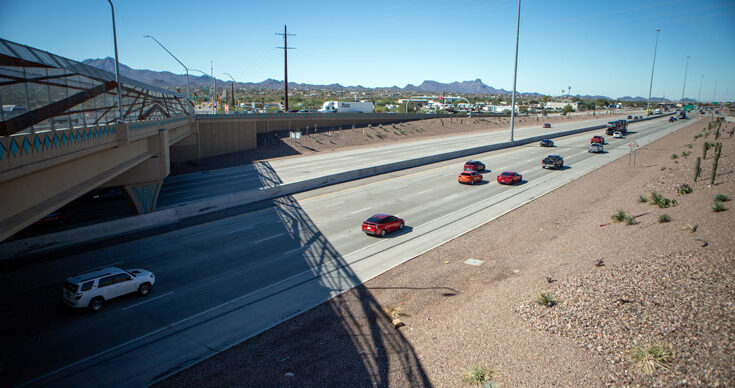
We analyzed newly released crash data from Arizona’s two largest cities — Phoenix and Tucson — to uncover where and why motor vehicle accidents happen most often. The findings reveal a clear trend: intersections are ground zero for serious crashes, especially in areas where high traffic, poor road design, and driver error collide.
Arizona drivers are no strangers to heavy traffic, quick merges, and unpredictable left turns. But some intersections are far more dangerous than others, and now the data proves it.
The Deadliest Intersections in Phoenix: A Closer Look
Arizona Motor Vehicle Crash Facts data from 2018 to 2022 reveals a troubling pattern in Phoenix: intersections are not just high-traffic zones but critical danger points where infrastructure, driver behavior, and urban development collide.
While the city has seen rapid population growth, much of its roadway infrastructure hasn’t been updated to meet the demands of modern traffic volumes. This mismatch has led to outdated signal timing, poor lane visibility, and intersection layouts that confuse both local and visiting drivers.
Let’s take a closer look at some of Phoenix’s most problematic intersections:
- 67th Ave & McDowell Rd
A chaotic mix of residential traffic, speeding commuters, and limited left-turn visibility makes this intersection one of the most crash-prone in the city. The flow often breaks down during peak hours, with rear-end and side-impact crashes being most common.
- 57th Ave & Camelback Rd
Surrounded by retail plazas, fast food chains, and gas stations, this intersection suffers from constant turning traffic, sudden stops, and distracted drivers entering and exiting parking lots.
- 19th Ave & Peoria Ave
Pedestrian-heavy, this area has frequent bus traffic and complex lane shifts. Accidents here often involve drivers attempting to “beat the light” while pedestrians try to cross multiple wide lanes.
- 67th Ave & Indian School Rd
A wide intersection that sees a heavy stream of high-speed traffic during the day. Poor lane discipline and frequent red-light violations contribute to dangerous side-impact and T-bone crashes.
- 43rd Ave & Indian School Rd
A major throughway where drivers often cut across multiple lanes to make last-minute turns. Aggressive merging, tailgating, and minimal reaction time create the perfect storm for multi-vehicle crashes.
What’s Fueling Phoenix’s Intersection Crashes?
Phoenix’s most dangerous intersections share several underlying issues that make them high-risk. Many suffer from outdated signal timing that no longer aligns with current traffic volumes, causing confusion and congestion. The wide layout of these intersections often encourages speeding and abrupt lane changes, especially during rush hour. In addition, a high volume of left turns is frequently handled without protected turn lanes or dedicated arrows, increasing the likelihood of side-impact collisions.
Adding to the danger, numerous driveways and business entrances sit close to these intersections, leading to unpredictable entry and exit points as drivers merge or turn with little warning. Finally, frequent pedestrian crossings—often with limited visibility—create further hazards for both walkers and drivers. When a crash happens under these conditions, a car accident lawyer in Phoenix can step in to investigate the scene, prove fault, and help victims pursue the compensation they’re legally entitled to.
Let’s take a look at the situation in Tucson
Tucson’s Top Crash Intersections: What the 2024 Data Shows
Tucson’s Traffic Collision data for 2024 paints a clear picture: intersections remain the most dangerous spots on the road, with a staggering 75.5% of all collisions happening at these junctions. While the city’s overall layout contributes to some of this, certain intersections consistently stand out due to the volume and nature of crashes.
Some of the most problematic locations include:
- Golf Links Road & Swan Road – A fast-moving eastside intersection with multiple turn lanes and limited sightlines, often clogged during school and commute hours.
- Broadway Boulevard & Wilmot Road – A busy commercial corridor where quick left turns, heavy pedestrian traffic, and shopping center access create constant conflict.
- Wetmore Road & Oracle Road – Located near malls and major shopping destinations, this intersection deals with high traffic density and sudden stops.
- Craycroft Road & Golf Links Road – Another eastside hotspot where multilane complexity and mixed residential-commercial traffic increase collision risk.
- Prince Road & Oracle Road – This north-central intersection sees frequent congestion, risky turns, and visibility issues due to nearby buildings and signage.
What the Data Reveals About Crash Patterns in Tucson
Most of the crashes in Tucson involve vehicle-to-vehicle impacts, with side-impact and rear-end collisions being the most common. These types of accidents often result from failed left turns, sudden lane changes, or aggressive merging, which are all typical in busy, multi-lane intersections.
From a geographic standpoint, the West division leads in total crashes, accounting for 28.8% of all reported incidents. This points to potential imbalances in infrastructure or traffic management compared to other parts of the city, like the South and East divisions, which also report high crash volumes.
Speeding and driver distraction are major contributors to these crashes, even if underreported. In many cases, the official data doesn’t fully capture how often drivers lose focus, glance at their phones, or misjudge another vehicle’s speed or position.
While 46% of reported crashes involve no visible injuries, this doesn’t mean victims walk away unscathed. Many experience soft tissue injuries, delayed symptoms like dizziness or neck pain, and emotional trauma that can surface days or even weeks later.
Intersections in Phoenix and Tucson are more than just traffic pinch points. They’re where most serious crashes happen. From poor road design to distracted drivers and risky turns, the danger is real. But so is your power to protect yourself. Stay alert, obey traffic signals, and always approach busy intersections with caution, especially those known for high crash rates.
ENDS
P.S. If using this story, please credit and link to https://www.floridainjuryadvocate.com/
Methodology
The research analyzed the data for fatal nighttime speeding crashes involving motorcyclists from 2019 to 2023 for each U.S. state via the NHTSA database. Average fatality rates per 100,000 residents were calculated to identify the states where motorcyclists are most at risk of experiencing fatal speeding crashes after dark.
Data Sources
Research by: https://www.floridainjuryadvocate.com/
Fatal Crash Data: https://cdan.dot.gov/query
Research Dataset: https://docs.google.com/spreadsheets/d/1Cl9KXctqBvV5cQhmW03kcjpRA_5n5qd-grEIuYVywXc/edit?gid=0#gid=0


